










The maintenance performance indicators worth tracking in 2026 answer three questions. Do residents get fixes fast? Do the fixes hold? And what does each fix cost? For residential and mixed portfolios, that means eight numbers. They are response time, completion time by priority, first time fix rate and preventive maintenance completion. Add the planned share of work, backlog age, cost per unit and vendor on time rate. Track each one by property every month, against your own baseline.
The 2026 maintenance KPI scorecard
Each indicator below has a formula you can run from closed work orders. None needs special equipment data.
| Indicator | Formula | What it tells you |
|---|---|---|
| Time to first action | Hours from request to first contact or visit, median | Whether residents feel heard |
| Time to complete, by priority | Hours or days from request to closeout, median, split by emergency, urgent and routine | Whether the team keeps its own promises |
| First time fix rate | Jobs fixed on the first visit ÷ eligible closed jobs × 100 | Whether fixes hold |
| Preventive maintenance completion | Scheduled PM tasks done on time ÷ PM tasks due × 100 | Whether the plan is real |
| Planned share of work | Planned labour hours ÷ total labour hours × 100 | How much time goes to firefighting |
| Backlog age | Open work orders by age band: under 7 days, 7 to 30, over 30 | Where jobs get stuck |
| Cost per unit by category | Labour, parts and vendor cost ÷ units, per month, by category | Where money goes |
| Vendor on time rate | Vendor jobs finished by the agreed date ÷ vendor jobs × 100 | Which vendors to keep |
For PM completion, the schedule itself has to be sound. Our multifamily preventive maintenance calendar sets out tasks by month.
Use medians for time based indicators. One stuck job that runs for 90 days will drag an average far from what a typical resident sees.
First time fix rate, the indicator to add this year
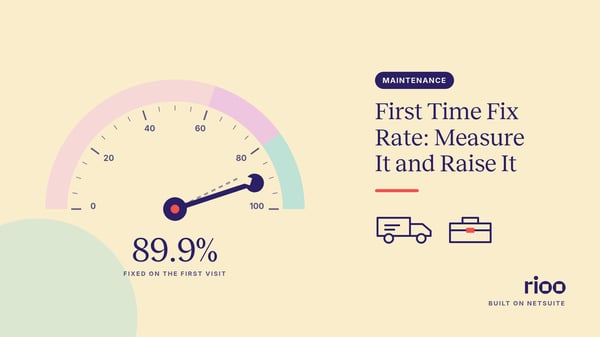
First time fix rate, or FTFR, is the share of jobs fully resolved on the first visit. A job counts as a repeat if the same unit reports the same problem again within a set window, often 30 days.
The formula is short:
FTFR = jobs fixed on the first visit ÷ eligible closed jobs × 100
Eligible jobs leave out work that was always planned as two visits, such as a countertop that needs a template visit first. A job where the technician arrived without the right part stays in, because that is what the measure is meant to catch. They also leave out visits where staff could not get in. Write those rules down before you start, or the number will drift. Our full guide to first time fix rate walks through one month of jobs, the repeat causes and the fixes that raise it.
A monthly scorecard, worked through
Here is an illustrative month for a team covering three communities and 540 units.
- Requests in the month: 212. Closed: 205.
- Median time to first action: 3 hours. Emergency jobs: median 1 hour.
- Routine jobs, median time to complete: 2.5 days, against a promise of 3.
- FTFR: 168 fixed first time out of 196 eligible, or 85.7%.
- PM completion: 58 of 64 tasks on time, or 90.6%.
- Backlog: 31 open jobs, 6 of them over 30 days old.
- Maintenance cost: $19,440, or $36 a unit.
Read the numbers together. Response and completion look healthy. The six jobs over 30 days are worth a closer look. In this example, four waited on one appliance vendor, and that vendor's on time rate was 61%. The fix is a conversation with that vendor. More technician hours would not move it.
Indicators that fit facility teams better
Some classic maintenance KPIs come from factories. Overall equipment effectiveness is one. It measures production output, which a rental building does not have.
Two industrial measures still help for major building systems:
Mean time between failures
MTBF is operating time divided by the number of failures, for one asset. Use it for boilers, chillers, elevators and pumps. A falling MTBF on one boiler is an early sign for the capital plan.
Mean time to repair
MTTR is total repair time divided by the number of repairs. For residential units, completion time by priority does the same job in terms residents feel. Keep MTTR for central plant.
For commercial and facility portfolios, our list of 12 facility management KPIs to track in 2026 covers space and energy measures as well.
Setting targets without guessing
Published benchmarks rarely match your buildings. Age, unit mix, climate and staffing all move the numbers. Start with three months of your own data as a baseline. Then set a target to improve on it.
Pick one indicator to push at a time. If you push speed and FTFR at once, technicians may close jobs fast and come back later. Pair each speed measure with a quality measure, so one cannot improve at the cost of the other.
Clean data comes from closeout. If a work order closes with "fixed" and nothing else, none of these numbers can be trusted. The work order closeout checklist lists the fields to capture before a job is marked closed.
Reporting maintenance KPIs to owners
Owners do not need eight charts. They need to know whether the buildings are being looked after and whether spend is under control. A short monthly page works well.
Lead with three figures: completion time for routine jobs, FTFR, and cost per unit against budget. Then list the jobs over 30 days old, with a reason for each. Close with anything the numbers point to for the capital plan, such as a boiler with three failures this quarter.
Keep the definitions fixed. If you change what counts as a repeat visit, say so on the page and restate last month on the new basis. An owner who sees FTFR jump five points after a rule change will stop trusting the page.
Show the last six months as a line. It says more than a single figure. It also stops a bad month from becoming a crisis, or a good month from hiding a slow decline.
Where the numbers come from in RIOO
In RIOO, requests from residents and inspections become work orders with category, priority and assignment to staff or vendors. Technicians close jobs from a phone with notes, photos, labour time and parts. Costs post to the property ledger in NetSuite. The work order management page lists the measures worth watching. They include time to first action, time to complete by priority, repeat requests within 30 days, cost per unit by category and vendor on time rate.
Maintenance KPI FAQ
How many maintenance KPIs should a property team track?
Eight is plenty for a monthly review. Report all eight, and choose one or two to improve each quarter.
Should I report averages or medians?
Use medians for time measures. Use totals and rates for cost and completion. Show the count of jobs beside each figure, so a small sample is obvious.
Which property management solutions track maintenance KPIs?
Look for a system where work orders, vendor bills and the property ledger share one record. Then response, completion, repeat visits and cost can come from the same data without spreadsheets.
How often should I review maintenance KPIs?
Monthly for the team, quarterly with owners. Review the backlog weekly, since old jobs are the ones residents remember.